Updated projections forecast a world starkly different from today’s, with poor countries accounting for nearly 70% of global GDP in 2030.
The late Angus Maddison documented how the international economic order had changed dramatically over the preceding 40 years. He was in no doubt that it would continue to do so. In the 1960s, the world was typically divided into a first, second, and third world. By the turn of the millennium, it was more common to talk of the “West” and the “Rest”, or even just the “Rich” and the “Rest” (Maddison 2001, 2002).
In a new report, the OECD Development Centre forecasts that by 2030 non-OECD economies will account for 57% of global GDP, up from just 40% in 2000 (OECD 2010). This remarkable turnaround is due to the dynamism of the developing world, in particular India and China. Combined with their large populations, this means that the economic centre of gravity of the global economy is changing rapidly, with all kinds of implications for economic policy in many spheres – macroeconomics, natural resource management, technology, agricultural, and development policy.
These figures were based on the groundbreaking work of the OECD Development Centre economic historian Angus Maddison, who passed away in April 2010 (see Harry Wu’s Vox column remembering Maddison’s life and work). Despite Maddison’s undisputed genius, he may well have underestimated the relative weight of developing countries in the global economy over the next two decades. Maddison made his forecasts on the basis of data available in 2003. Subsequent events reveal a markedly different story to the one apparent then.
Shifting wealth and the global economy
In “Contours of the World Economy 1-2030”, Maddison (2007) provided comprehensive forecasts for the global economy, based on the Geary-Kharis purchasing power parities.1 He classified countries into two broad groups: the “Rich” countries and the “Rest” – a group of developing countries including some, such as South Korea, that are now classified as high-income due to strong growth.2
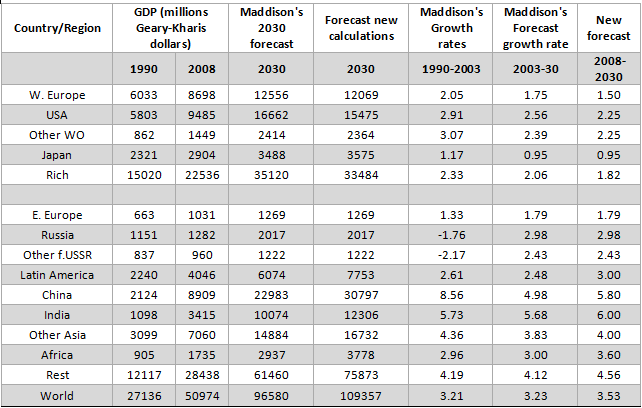
The scenarios depicted below (Table 1) include a revision of Maddison’s estimates for Asia, Latin America, and Africa. They also revise downwards the growth estimates for the rich countries in the aftermath of the financial crisis, motivated by recent studies that suggest that long-term growth in high-income countries may be dragged down by the high fiscal burdens resulting from the crisis (e.g. Reinhart and Rogoff 2010). It may also, of course, take a long time to sort out some of the other structural imbalances impacting growth performance in many industrial economies.
Table 1. Shifting wealth and the world in 2030 – New forecasts

Source: Author, based on Maddison (2007:Table 7.1) and updated from data available at the Groningen website (http://www.ggdc.net/maddison/).
China and India
Given their growing economic weight in the global economy, forecasts for China and India are of crucial importance. While acknowledging that China had been the most dynamic of the Asian economies in the past three decades, Maddison argued that its growth would decelerate for several reasons related to demographic trends, environmental damage, the rural-urban divide, and a natural slowdown as Chinese wages rise and the technological frontier gets closer to that of the advanced countries.
Not everyone agrees, however. Fogel (2010), for instance, recently suggested that the Chinese economy will be worth $123 trillion in 2040, accounting for 40% of global GDP, implying a 9% growth rate sustained over the next three decades. He ascribes this forecast to investments in education, decentralised control over economic decision-making, burgeoning consumer demand, and to the spread of growth from the coastal areas towards the rural hinterlands. Clearly, there is a wide gap in these interpretations (four percentage points per year). I err on the side of caution, accepting some of the arguments about future bottlenecks to growth, and have revised Maddison’s figures upwards in the light of the strong performance of the Chinese economy since 2003 from 4.98% to 5.80%.
In India, there are similar debates regarding the medium- to long-term prospects for growth. Despite a significantly lower growth performance over the last two decades, over the long run India actually has some advantages over China. India has democratic governance, a stronger financial infrastructure, a more vigorous private sector in key areas such as ICTs, and more favourable demographic trends (a working age share of the population that will not peak until the 2030s, compared to 2010 for China). India’s GDP growth rate has already increased from about 6% in the 1990s to around 9% in the second half of the 2000s. As a consequence, I revise Maddison’s long-run forecast up from 5.68% to 6.0%.
Latin America
Maddison portrayed a fairly bleak assessment of the performance of Latin America, noting that, with the exception of Chile, most countries in the region achieved only a modest advance in per capita income between 1990 and 2003. He explained this by pointing to the failure to push through decisive policy reforms. Yet Maddison’s forecasts missed the upturn in regional economic performance in the 2000s, when Latin America actually experienced one of the strongest periods of economic growth since the 1960s, driven by a combination of higher commodity prices and better macroeconomic management. In the last decade, the region has also avoided the kind of financial crises that paralysed economic performance in previous decades. As a result of these new trends, the forecasts here revise Maddison’s growth forecasts from 2.48% to 3% annually.
Africa
Maddison was also relatively pessimistic about Africa’s prospects. He highlighted the negative impact of rapid population growth, the pervasive incidence of infectious and parasitic disease, and low levels of literacy as key constraints on growth performance. Ultimately, however, he stressed the indigenous obstacles to improved performance, in terms of what he saw as poor economic policy management. Again, subsequent events would seem to warrant a revaluation of this forecast (from 3% to 3.6%). As in Latin America, economic performance in Africa improved strongly in the period from 2001 to 2008 after two decades of weak performance. Post-economic crisis, African countries have also benefited from the quick rebound in commodity prices, and their growth has been shored up by investments and trade with the emerging economies. A significant reduction in the debt burden for many countries, together with greater inflows of private capital and better macroeconomic management, means that the prospects for many African countries are better than they have been since the 1970s.
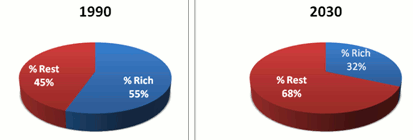
Figure 1. Global GDP – the “Rich” and “Rest” shares 1990-2030

Source: Author’s calculation based on Table 1.
Finally, the forecasts revise upwards for the region Maddison calls ‘other Asia’, from 3.83% to 4.00%. Together, the result of these modifications to Maddison’s forecasts is that the global economy in 2030 will be starkly different to the present one, with the “Rest” accounting for nearly 70% of the global economy, compared to just 45% in 1990 (Figure 1).
Conclusions
Although the adjustments made here to Maddison’s growth forecasts are small ones, their impact over the long term are quite large. Such is the nature of compound growth. But are these assumptions realistic ones? To the extent that the Maddison calculations do not fully reflect the upsurge in economic growth in much of the developing world up to 2007, the answer would appear to be yes.
Yet different demographic trends need to be kept in mind when considering what these figures mean for convergence of income per capita levels. Maddison worked on the assumption (based on forecasts by the UN Population Division) of an average growth in the population in the “Rest” of 1.08% per year, compared with only 0.32% per year for the rich group of countries. This let him arrive at an income per capita of $8,504 per capita in 2030 for the rest, compared to $37,086 for the rich countries – meaning that the developed economies will remain more than four times richer. If the World Bank (2009) revised PPP figures were used, the income gap would be larger still.
Absolute economic size matters on many levels – in terms of market potential, resource requirements, energy consumption, etc. However, in the final resort, what matters for economic development is the level of per capita income. The developing world may be on the verge of a ‘golden age’ in terms of its economic clout in the global economy, but aspirations of achieving standards of living comparable to those in high-income OECD countries are still a long way from being fulfilled.
Editors' note: This column first appeared as a column on VoxEU.org on 24 October 2010.
References
Fogel, R (2010), “$123,000,000,000,000*”, Foreign Policy, January.
Maddison, Angus (2001), The World Economy: A Millennial Perspective, OECD Publishing.
Maddison, Angus (2002), “The West and the Rest in the International Economic Order”, OECDObserver.org.
Maddison, A (2007), Contours of the World Economy 1-2030: Essays in Macro-Economic History, Oxford University Press.
Maddison, A, and HX Wu (2008), “Measuring China’s Economic Performance”, World Economics, 9(2):April-June.
OECD Development Centre (2010), “Perspectives on Global Development 2010 – Shifting Wealth”, OECD, Paris.
Reinhart, C and KS Rogoff (2010), “Growth in a Time of Debt”, NBER Working Paper 15639.
World Bank (2009), International Comparison Program data, World Bank.
Wu, Harry X (2010), “Love affairs with Chinese and Japanese numbers”, VoxEU.org, 28 July.
1 These PPPs are controversial and contested by the World Bank (2007), which undertook a major revision of its own PPPs and subsequently revised downwards the price adjustments by a number of major developing countries, including China by a margin of approximately 40%. Maddison never accepted the validity of these revisions, on a number of technical grounds (Maddison and Wu 2008). In any case, at current rates of growth, these differences would delay the surpassing of high-income countries by developing countries by a matter of four or five years – it would not radically change the projections.
2 This is arguably the right way to classify the relative size of developing and developed economies – a constantly moving goalpost, whereby countries are reclassified periodically, means that “developing countries” becomes a residual group once all those which have performed strongly have graduated into the ranks of high-income countries. The correct way of classification is, as Maddison did, to classify countries at the beginning of the period under study and maintain that classification throughout.

