Amidst rapid urbanisation and climate change, evidence on urban expansion and flood exposure can help policymakers increase climate resilience in the world’s cities.
As people move in search of economic opportunities, the world’s cities are growing rapidly in terms of their populations and spatial footprints. Urbanisation traditionally goes hand-in-hand with economic development, as cities attract people, ideas, and capital, which in turn foster agglomeration economies. But when new neighbourhoods and industrial developments spring up, often located in flood zones, rapid urbanisation can also increase exposure to natural hazards, put pressure on public services and infrastructure, and make people more vulnerable.
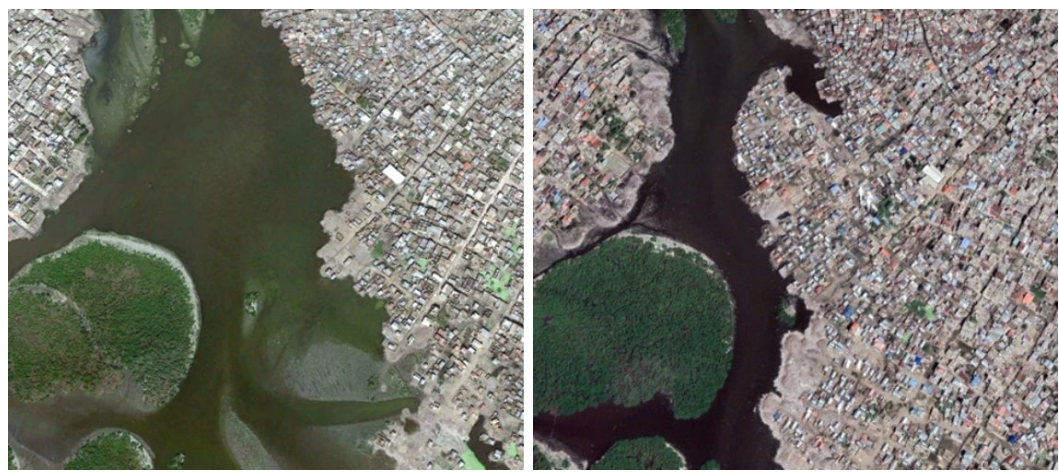
This creates a major challenge, particularly in low- and middle-income countries, which often lack the capacity for risk-informed urban and infrastructure planning, and the resources to invest in transport and protection infrastructure. And as safe spaces in cities are increasingly occupied and land becomes scarce, new developments are built disproportionately in previously avoided areas, such as riverbeds, flood plains, and wetlands.
Figure 1: Riverside settlement expansion in Cap-Haïtien, Haiti, 2010 (left) and 2021 (right)

Source: Google Earth, Maxar Technologies.
Systematic evidence of growth into flood zones
Intensifying natural hazards due to climate change are forcing countries to step up action to adapt to climate risks. In response to rising losses and damages, countries are committing to comprehensive adaptation and resilience strategies. Yet, tracking their successful progress in adaptation has been difficult.
In the past, the lack of high-resolution flood hazard maps and annual settlement footprint data has limited the systematic analysis of global flood exposure trends (Neumann et al. 2015). Previous studies have used historical records of flood events to estimate exposure indicators at country level (Peduzzi et al. 2009) or historical satellite imagery to offer important insights on the growing populations affected by floods (Tellman et al. 2021). But such studies do not shed light on the underlying spatial expansion and exposure patterns of flood hazards and human settlements, making it difficult to accurately consider evolving urban shapes and compare flood exposure over time (Neumann et al. 2015, de Bruijn et al. 2019, Muis et al. 2016).
In Rentschler et al. (2023), we provide systematic evidence that, since 1985, human settlements around the world—from small villages to large cities—have continuously and rapidly expanded into flood zones. We find that settlement growth in high-risk flood zones is outpacing growth in safe areas by a large margin, particularly in East Asia. Instead of adapting their exposure, many countries continue to amplify their exposure to increasingly frequent climatic shocks.
Spatial urbanisation patterns: Methods and data
Our global analysis of spatial urbanisation patterns and their evolving exposure to 1-in-100-year flood hazards uses high-resolution global flood hazard maps by the European Commission’s Joint Research Centre and Fathom, as well as the World Settlement Footprint Evolution (WSF-Evo) dataset by the German Aerospace Center (DLR), which offers high precision measurements of human settlements from 1985 to 2015 at 30-by-30-metre spatial resolution and with global coverage.
The results presented here are derived through a computational workflow that we can simplify into three analytical steps:
- Identifying built-up areas using the World Settlement Footprint Evolution dataset.
- Assigning each settlement pixel to one of five flood-hazard categories, defined by risk to lives and livelihoods. This step is repeated for each settlement and year.
- Computing the total settlement area per flood-hazard category for each subnational administrative unit per year and calculating its share of the corresponding overall settlement area, addressing limitations of settlement over- or underestimation and aggregating exposure.
We conduct extensive sensitivity and robustness tests, through photointerpretation of high-resolution satellite historical imagery, variation of inundation depth thresholds and flood probabilities and types.
This allowed us to track the speed and shape of urban expansion and estimate flood exposure with high precision, offering new insights for understanding what share of countries’ built-up land is exposed to high flood hazards and how this evolves over time.
Urbanisation is more rapid in flood-prone areas
Between 1985 and 2015, the world’s urban settlements grew by 85%, from 693,000 to 1.28 million km squared, so that by 2015, 11% of all settlement areas (145,000 km squared) were in zones with high or very high flood risk. Since 1985, about 36,500 km squared of newly urbanised land was added in locations with inundation depths of over 1.5 meters during severe floods – equivalent to 23 times the area of Greater London.
East Asia has the highest increase in exposure
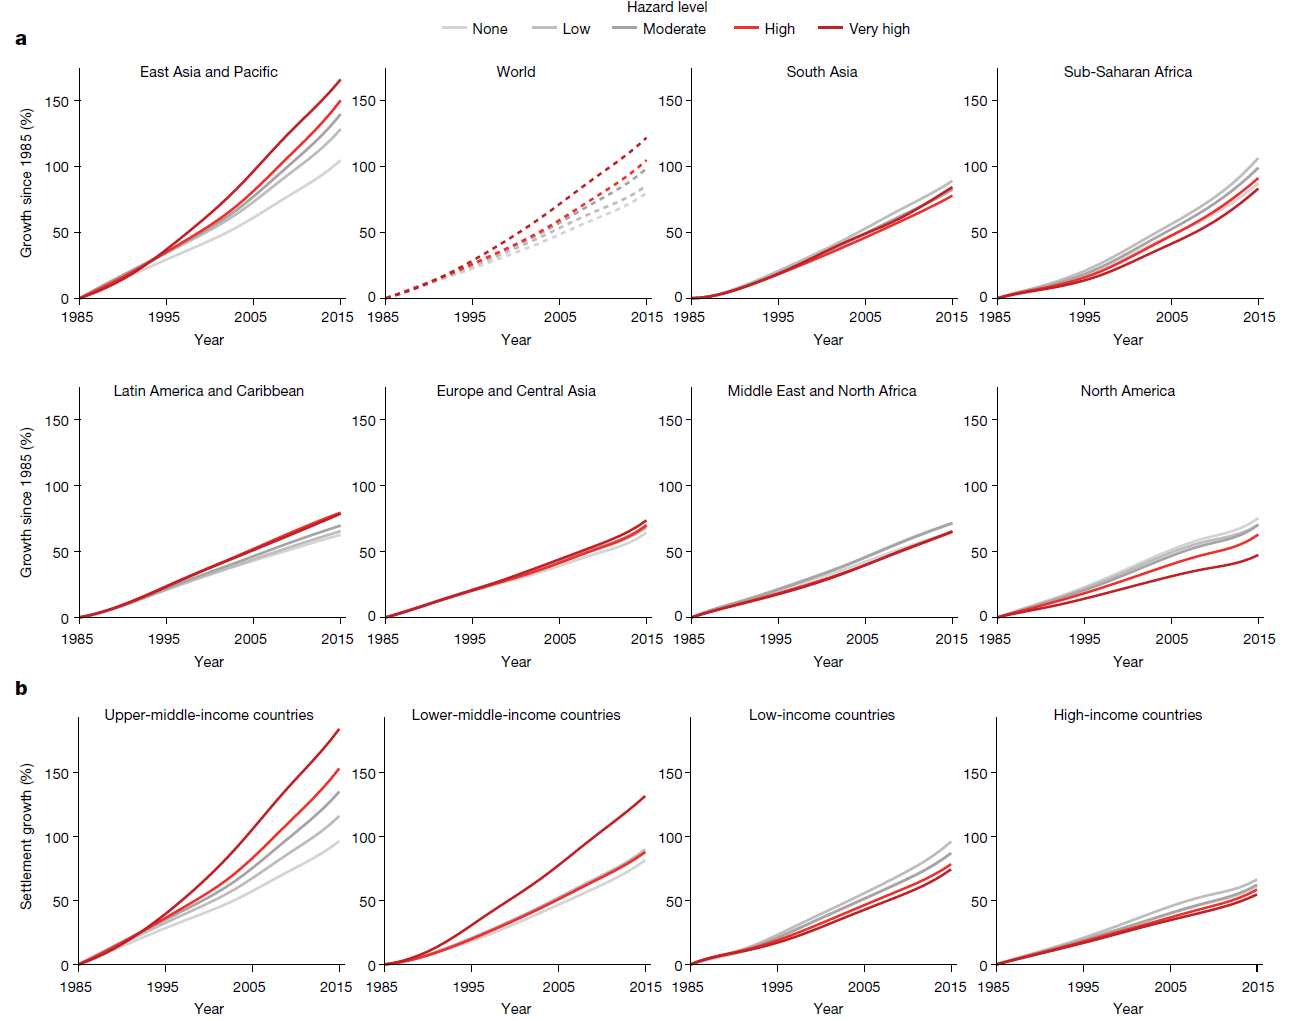
Settlement expansion in high-hazard flood zones outpaces growth in flood-safe areas. Although the world’s overall settlement extent has increased by 85%, settlements with high flood-hazard exposure have grown by 106% and those exposed to the highest flood-hazard level by 122%. It has been fastest in the East Asia and Pacific region, where no-risk settlements have expanded by just over 100%, while very high-risk settlements have expanded by over 160%. In North America, on the other hand, safe settlements have expanded by 75%, and the highest-risk settlements by 49%. But even here, settlements in high-risk flood zones have continued to expand, exposing an ever-growing number of people and assets to flood risks.
Figure 2: Settlement growth (%) by hazard level

Notes: Panel a) shows growth by regions; b) by income grouping. Charts are sorted from fastest to slowest high-hazard growth. Source: Rentschler et al. 2023.
A growing divergence in flood exposure
Our study shows a global trend of increased settlement expansion in areas with high flood hazard levels, with about 76,400 km squared of settlements newly built in the highest-risk zones since 1985. Of these settlements newly built in the highest-risk zones 81% are in middle-income countries, only 1% are in low-income countries, and 18% are in high-income countries. In middle-income countries settlement growth in flood zones is fast outpacing growth in flood-safe areas. Settlement growth in the riskiest areas is highest in upper-middle-income countries (184%), at nearly twice the rate of safe settlements (96%).
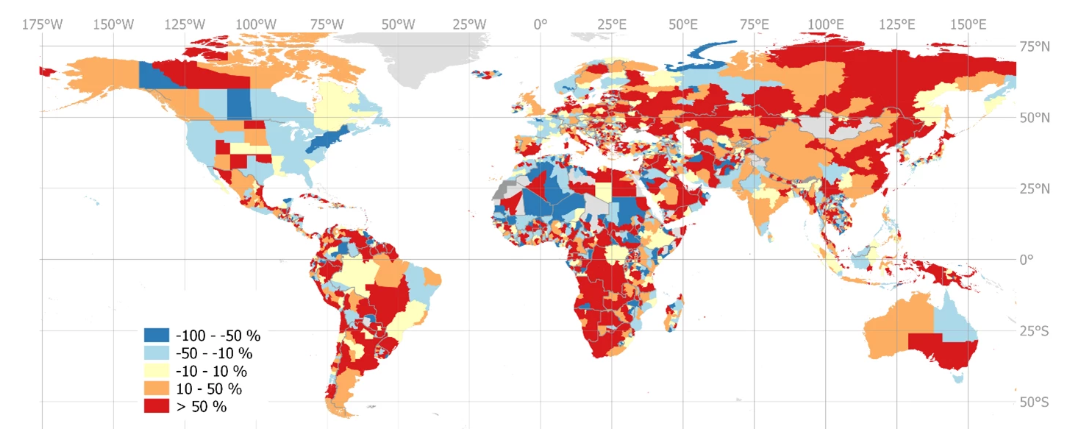
Figure 3: Settlement growth in safe and high hazard areas, 1985–2015

Note: In red areas, the share of flood exposed settlements is increasing (that is, settlements in high-hazard flood zones have expanded at least 50 percent more than those in flood-safe areas). In blue areas, flood exposure is decreasing. Source: Rentschler et al. 2023.
In low-income countries, there has been more settlement growth on safe land (87%) than in high-risk areas (77%). This may be due to slower urbanisation, which puts less pressure on using all available land, including the riskiest. But as low-income countries follow a path of economic growth in the coming years, accelerating urbanisation rates will speed up development. Without risk-informed urban planning and appropriate zoning policies (see Avner and Hallegatte 2019), climatic risk exposure in low-income urban hubs is likely to increase.
Implications of growing flood risks for urban planning and climate resilience
Although it can be politically convenient to see climate change as an exogenous force that places disasters beyond the influence of local authorities (Raju et al. 2022, Larsen and Ribot 2022), people’s exposure to climate hazards and vulnerability to climate shocks is determined not only by the changing climate, but also by local spatial development choices (Hallegatte et al. 2017).
In an age of increasing disaster losses due to flooding, effective mitigation efforts must be based on a robust understanding of the contributing factors to flood risk. These can include intensifying hazards (as a result of climate change), increasing exposure to hazards (due to expanding at-risk settlements), and rising vulnerability to shocks (due to inadequate building standards or social protection systems). Our study shows that increased exposure is key to understanding the global rise in flood disaster losses, and continuous monitoring of urbanisation and flood exposure patterns can help guide timely interventions.
Our results show a pattern of divergence in exposure to flood hazard, with flood exposure rapidly growing in some areas, and shrinking in others. These findings carry concrete implications for urban planners and policy makers. Where flood exposure is already high, investing in disaster preparedness and protection—such as early warning systems, social protection, and protective infrastructure—is crucial to mitigate losses. And where flood exposure is still low but rapidly increasing, planners can avoid new construction in the highest-risk areas by urgently revising land use and urbanisation plans and updating risk-informed building codes and infrastructure masterplans. Urbanisation is usually impossible or too expensive to reverse, locking in high-risk patterns with large economic and human consequences. And while land scarcity and geographic constraints mean that flood zones cannot always be avoided, careful planning of protection systems and disaster preparedness can support resilient socioeconomic development.
Editor’s note: An earlier version of this blog appeared on World Bank Blogs: Sustainable Cities.
References
Avner, P, and S Hallegatte (2019), Moral Hazard vs. Land Scarcity Flood Management Policies for the Real World, Washington DC: World Bank Group. Available at: http://documents.worldbank.org/curated/en/523861568387904704/Moral-Hazard-vs-Land-Scarcity-Flood-Management-Policies-for-the-Real-World.
de Bruijn, J A, H de Moel, B Jongman, M C de Ruiter, J Wagemaker, and J C H Aerts (2019), “A global database of historic and real-time flood events based on social media,” Scientific Data, 6: 311. https://www.nature.com/articles/s41597-019-0326-9.
Hallegatte, S, A Vogt-Schilb, M Bangalore, and J Rozenberg (2017), Unbreakable: Building the Resilience of the Poor in the Face of Natural Disasters, Washington DC: World Bank Group. Available at: http://documents.worldbank.org/curated/en/512241480487839624/Unbreakable-building-the-resilience-of-the-poor-in-the-face-of-natural-disasters.
Lahsen, M, and J Ribot (2021), “Politics of attributing extreme events and disasters to climate change,” Wiley Interdisciplinary Reviews: Climate Change, 13: e750. https://wires.onlinelibrary.wiley.com/doi/10.1002/wcc.750.
Muis, S, M Verlaan, H C Winsemius, J C Aerts, and P J Ward (2016), “A global reanalysis of storm surges and extreme sea levels,” Nature Communications, 7: 11969. https://www.nature.com/articles/ncomms11969.
Neumann, B, A T Vafeidis, J Zimmermann, and R J Nicholls (2015), “Future coastal population growth and exposure to sea-level rise and coastal flooding - A global assessment,” PLoS One, 10: e0118571. https://doi.org/10.1371/journal.pone.0118571.
Peduzzi, P, H Dao, C Herold, and F Mouton (2009), “Assessing global exposure and vulnerability towards natural hazards: The Disaster Risk Index,” Natural Hazards and Earth System Sciences, 9(4): 1149–1159. https://doi.org/10.5194/nhess-9-1149-2009.
Raju, E, E Boyd, and F Otto (2022), “Stop blaming the climate for disasters,” Communications Earth and Environment, 3(1). https://www.nature.com/articles/s43247-021-00332-2.
Rentschler, J, P Avner, M Marconcini, R Su, E Strano, M Vousdoukas, and S Hallegatte (2023), “Global evidence of rapid urban growth in flood zones since 1985,” Nature, 622: 87–92. https://doi.org/10.1038/s41586-023-06468-9.
Tellman, B, J A Sullivan, C Kuhn, A J Kettner, C S Doyle, G R Brakenridge, T A Erickson, and D A Slayback (2021), “Satellite imaging reveals increased proportion of population exposed to floods,” Nature, 596: 80–86. https://www.nature.com/articles/s41586-021-03695-w.


