Air pollution causes seven million deaths each year. New evidence from Pakistan shows that improving individuals’ ability to forecast air pollution allows them to adapt better.
Forecasts are needed to adapt to deadly air pollution
Air pollution has become one of the most urgent public health issues globally, with the World Health Organization (WHO) attributing it nearly seven million deaths each year – more than twice the annual death toll from COVID-19 (Gardiner 2022). In addition to its effects on mortality and health (e.g. Knittel et al. 2016, Arceo et al. 2016), a growing body of research documents the harmful effects of air pollution on labour productivity (e.g. Chang et al. 2016a, Neidell 2017), labour supply (Hanna and Oliva 2015), and even learning outcomes (Bharadwaj et al. 2017).
While lowering air pollution levels in the coming years will be crucial, in the meantime there has been a focus on adaptation — people taking costly actions to limit their exposure to harmful air such as wearing N95 masks, limiting time outdoors, or running air purifiers (Kala et al. 2023). Effective adaptation requires accurate forecasting (Bakkensen and Barrage 2022) — knowing when to take these costly actions. However, while accurate forecasts are easy to find in many wealthy cities, they are missing from those places where they are needed the most—highly polluted developing country cities like Lahore, Pakistan. In this context, not only are there no high-quality air pollution forecasts, but low levels of education inhibit Lahoris (local residents of the city of Lahore) from forming accurate forecasts themselves (Hanushek 2013).
We conducted a randomised controlled trial (RCT) in Lahore, Pakistan, one of the most polluted cities in the world, to evaluate the impact of two interventions: day-ahead air pollution forecasts and a general training of forecasting skills. Using state-of-the-art survey elicitation methods, we find that both interventions improved Lahoris’ ability to forecast air pollution, with the training leading to durable improvements in forecast accuracy even months after the intervention. Both interventions also led to increased adaptation to air pollution, evidenced by a greater demand for N95 masks and better alignment of time outdoors with air pollution levels. Importantly, we also document a meaningful demand for air pollution forecasts in Lahore, suggesting Lahoris are aware of the challenge they face in adapting to air pollution and that improving forecasts would generate large social welfare gains.
Two interventions to improve air pollution forecasts: day-ahead air pollution forecasts and forecasting skills training
When we began this research in 2019, there were no reliable air pollution forecasts in Lahore. Thus, we first had to build our own forecast model. To do so, we combined readings from high-quality monitors we procured with satellite-based forecasts. Figure 1 shows the alignment between the predictions of our model and the actual air quality levels. This figure also demonstrates the extreme air pollution faced by Lahoris—the WHO designates air quality levels above 150 as unhealthy, 200 as very unhealthy, and 300 as hazardous (U.S. Environmental Protection Agency 2023). While not perfect, our model was much more accurate than citizens forecasts at baseline. This is documented in Figure 2. We provided our forecasts to treated Lahoris via daily SMS messages, sent at roughly 8pm when families were likely sitting down to dinner and planning the day ahead.
Figure 1: Forecasts: Predicted vs. Actual Values
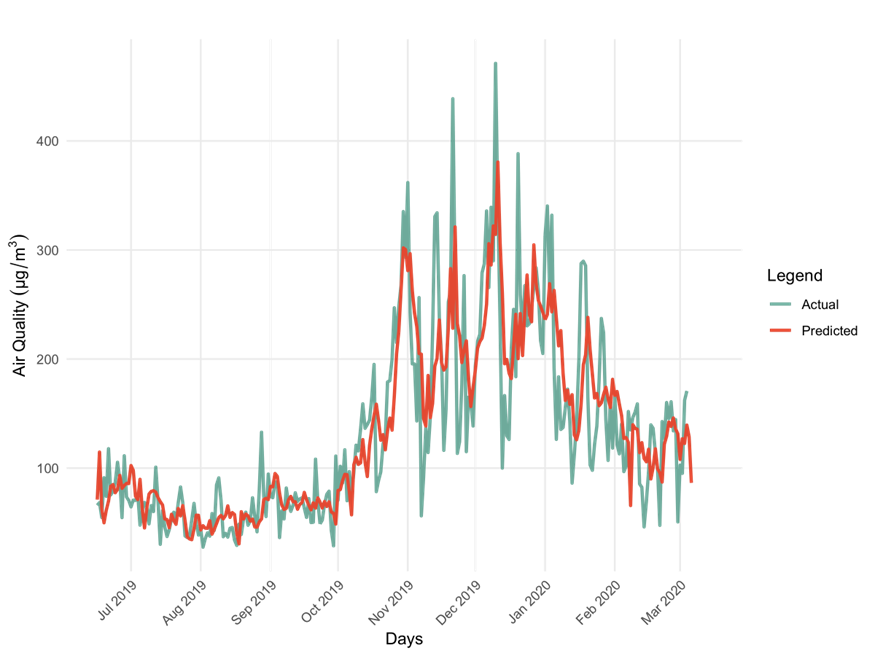
Notes: This figure shows the alignment between predicted air quality levels and the actual levels, highlighting how effective our prediction model was in providing day-ahead forecasts. Accurate forecasts were instrumental in helping individuals make better decisions on high-pollution days.
Figure 2: Baseline Subject Forecast Error vs. Our Model’s Error
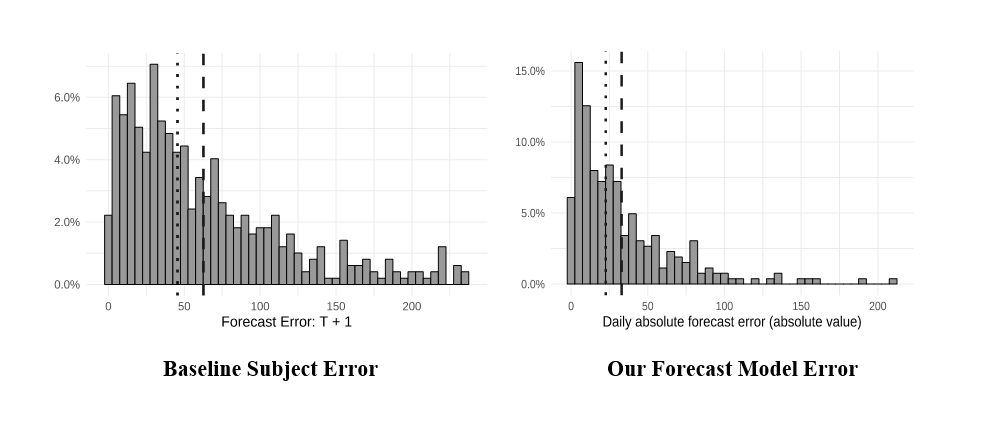
Notes: Our model shows significantly better accuracy than the baseline forecasts provided by participants, highlighting the potential for structured forecasting approaches to improve predictions.
We also built our own forecasting skills training. Drawing from the principles of Philip E. Tetlock’s research on forecasting accuracy (Tetlock 2017), the training aimed to reduce common biases such as overconfidence and ignoring general trends. The training emphasised a balanced approach to forecasting, teaching participants to integrate both "inside" views (e.g. localised event-specific data such as the chance of rain or shutdown of factories tomorrow) and "outside" views (e.g. historical averages and broader trends) into their predictions (Kahneman and Lovallo 1993, Lovallo et al. 2012). This training was designed for the local context and language. It was administered once in person at the homes of the respondents and was completed in an hour.
We provided these daily air pollution forecasts and forecasting skills training as an RCT in a sample of 1100 households in a lower-middle income neighbourhood in Lahore. Forecasts were delivered from June 2019 to February 2020, while trainings were conducted in August and September 2019.
Both interventions improved forecasting and adaptation in Pakistan
First, we document the impact of our two interventions on respondents’ ability to form accurate air pollution forecasts. Figure 3 presents endline forecast errors for four different groups: the control, group, those who received SMS forecasts only, those who received training only, and those who received both interventions. All three treatment groups saw reductions in forecast error relative to the control, with participants in the training and combined forecast-training groups exhibiting the lowest forecast errors. On average, our interventions reduced error in incentivised forecasts (using payments for responses within 5, 10, or 20% of realised particulate pollution) of fine particulates (PM2.5) by roughly one-tenth of a standard deviation, or 5 ![]() . These equal approximately 20% of the World Health Organization’s corresponding maximum safe 24-hour standard. While both interventions reduced the mean (average) forecast error, training additionally reduced the variance (or spread) of forecast error across subjects. The improvement in mean forecast error is driven by reduced underestimation of air pollution levels.
. These equal approximately 20% of the World Health Organization’s corresponding maximum safe 24-hour standard. While both interventions reduced the mean (average) forecast error, training additionally reduced the variance (or spread) of forecast error across subjects. The improvement in mean forecast error is driven by reduced underestimation of air pollution levels.
Figure 3: Control vs. Treatment Forecast Error at Endline
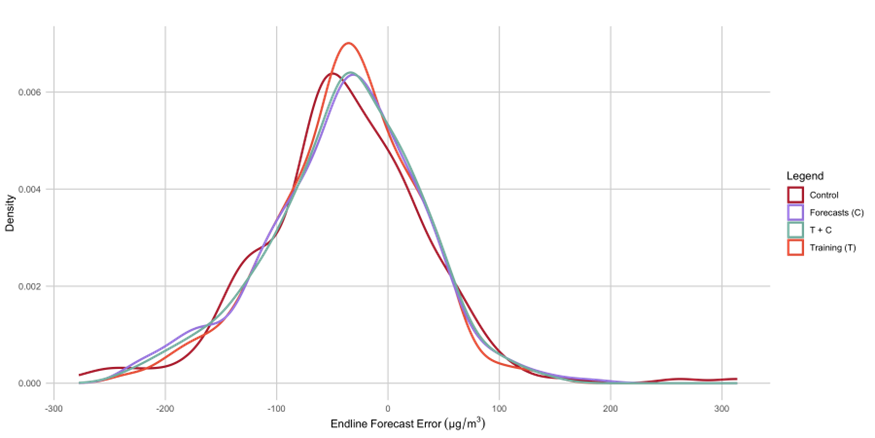
Notes: Participants in the training and combined forecast-training groups achieved lower forecast errors, indicating the sustained impact of training on forecasting ability.
Second, we find that air pollution forecasts led to improved adaptation behaviour. We find that forecast provision increased willingness to pay for particulate-filtering masks by 6.6 PKR, roughly 5% of the retail price (Becker et al. 1964). In addition, through detailed time-use diaries, we find that individuals who received daily SMS forecasts reduced their outdoor time during high-pollution days, while maintaining more outdoor activities on less polluted days. This is shown in Figure 4.
Figure 4: Treatment Effects on Outdoor Time and Child Outdoor Time
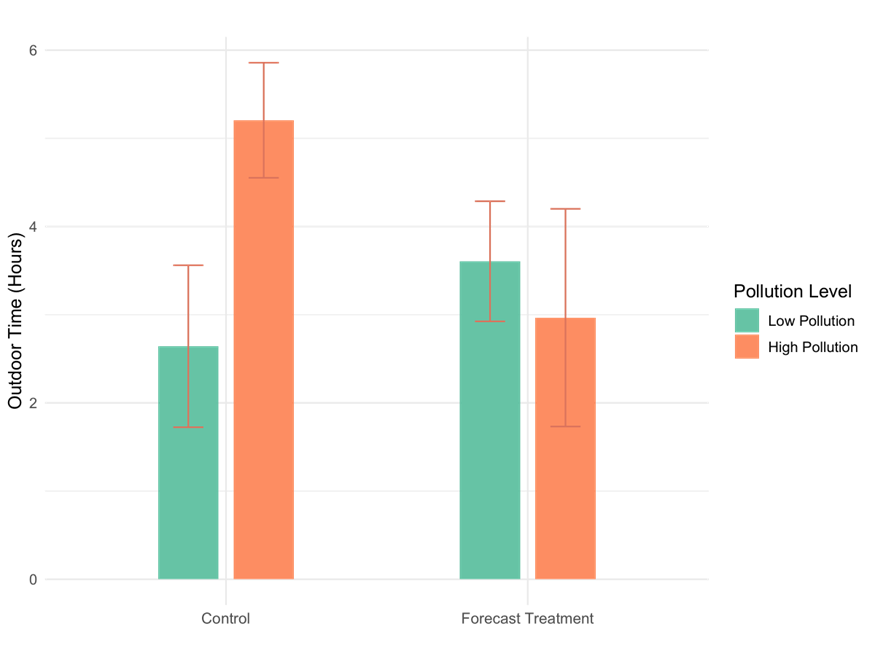
Notes: Participants in the Forecast Treatment group adjusted their outdoor activities in response to high pollution levels, demonstrating the behavioural impact of forecast training. Error bars represent 95% confidence intervals.
Additional results in our paper leverage the timing of the training relative to the SMS forecast intervention to document a surprising fact—that forecasts and forecast skills training are substitutes in this context. While both are impactful individually, combining the two interventions is no better than offering one or the other. We also test several mechanisms in our paper by which our interventions led to improved forecast ability.
Policy implications: Investing in information and human capital can help individuals adapt to air pollution
While the focus of our research is on the mechanisms of individual adaptation, the findings have significant implications for broader policy design. The results suggest that investments in air quality monitoring, paired with efforts to build local forecasting capabilities, can provide substantial welfare gains. In cities like Lahore, where air quality regulations are not strictly enforced, providing accurate forecasts and equipping residents with the skills to interpret these forecasts can help them make more informed decisions (Chang et al. 2016b, Arceo et al. 2016). And Lahoris know this—at the end of our study we gave respondents a chance to buy an additional three months of SMS forecasts. The average WTP was 93 rupees, implying an annual aggregate WTP for the city of Lahore of roughly 3.6 billion PKR, or US$12.7 million.
Our study also emphasises that information provision and training can act as substitutes in certain contexts. For example, while direct access to day-ahead forecasts is valuable, the skills gained through training can reduce the dependency on continuous information streams, as individuals learn to form their own predictions based on available data. This complements findings from the literature, such as Patel (2023) and Adhvaryu et al. (2022), which show that demand for environmental information is often accompanied by an increased willingness to pay when individuals perceive value in the forecasts provided.
References
Adhvaryu, A, N Kala, and A Nyshadham (2022), “Management and shocks to worker productivity,” Journal of Political Economy, 130(1): 1–47.
Arceo, E, R Hanna, and P Oliva (2016), “Does the effect of pollution on infant mortality differ between developing and developed countries? Evidence from Mexico City,” The Economic Journal, 126(591): 257–280.
Bakkensen, L A, and L Barrage (2022), “Going underwater? Flood risk belief heterogeneity and coastal home price dynamics,” The Review of Financial Studies, 35(8): 3666–3709.
Becker, G M, M H DeGroot, and J Marschak (1964), “Measuring utility by a single-response sequential method,” Behavioral Science, 9(3): 226–232.
Bharadwaj, P, M Gibson, J G Zivin, and C Neilson (2017), “Gray matters: Fetal pollution exposure and human capital formation,” Journal of the Association of Environmental and Resource Economists, 4(2): 505–542.
Chang, T, J Graff Zivin, T Gross, and M Neidell (2016a), “Particulate pollution and the productivity of pear packers,” American Economic Journal: Economic Policy, 8(3): 141–169.
Chang, T, J Graff Zivin, T Gross, and M Neidell (2019), “The effect of pollution on worker productivity: Evidence from call center workers in China,” American Economic Journal: Applied Economics, 11(1): 151–172.
Chang, W, E Chen, B Mellers, and P Tetlock (2016b), “Developing expert political judgment: The impact of training and practice on judgmental accuracy in geopolitical forecasting tournaments,” Judgment and Decision Making, 11(5): 509.
Gardiner, B (2022), “The deadly air pollution that’s all around us,” The New York Times.
Hanna, R, and P Oliva (2015), “The effect of pollution on labor supply: Evidence from a natural experiment in Mexico City,” Journal of Public Economics, 122: 68–79.
Hanushek, E A (2013), “Economic growth in developing countries: The role of human capital,” Economics of Education Review, 37: 204–212.
Kahneman, D, and D Lovallo (1993), “Timid choices and bold forecasts: A cognitive perspective on risk-taking,” Management Science, 39(1): 17–31.
Kala, N, C Balboni, and S Bhogale (2023), “Climate adaptation,” VoxDevLit, 7: 3.
Knittel, C R, D L Miller, and N J Sanders (2016), “Caution, drivers! Children present: Traffic, pollution, and infant health,” Review of Economics and Statistics, 98(2): 350–366.
Lovallo, D, C Clarke, and C Camerer (2012), “Robust analogizing and the outside view: Two empirical tests of case-based decision making,” Strategic Management Journal, 33(5): 496–512.
Neidell, M (2017), “Air pollution and worker productivity,” IZA World of Labor, pages 1–11.
Patel, D (2023), “Learning about a warming world: Attention and adaptation in agriculture,” SSRN Electronic Journal.
Tetlock, P E (2017), Expert Political Judgment: How Good Is It? How Can We Know? Princeton University Press.
U.S. Environmental Protection Agency (2023), “Patient exposure and the air quality index,” Accessed: 2024-10-14.
World Health Organization (2006), WHO Air Quality Guidelines for Particulate Matter, Ozone, Nitrogen Dioxide, and Sulfur Dioxide: Global Update 2005: Summary of Risk Assessment, Geneva: World Health Organization.


