


Little is known about the contribution of place-based policies in promoting economic development in emerging and developing countries. Through what channels do these policies, such as Special Economic Zones in India, promote development, if at all? Do they affect women workers differently from men?
The debate about place-based policies
Most countries have implemented place-based policies to reduce regional disparities and promote economic development. However, there is an ongoing debate about the appropriateness of these policies to achieve these goals. Building on the concept of spatial equilibrium, in which people are freely mobile across places, the prevailing mantra in urban and regional economics has been that helping poor people is more efficient than helping poor places (Austin et al. 2018). The argument has been that helping regions through transfers or tax breaks will induce migration, thus spreading the benefits (or costs) of the policy across space. More recently, this conclusion has been questioned in the academic literature (e.g. Fajgelbaum 2020). Barriers to mobility and equity goals may provide cases where place-based policies could be an efficient tool to help poor people in poor places.
The empirical literature is so far inconclusive (Neumark and Simpson 2015) and mostly focused on developed countries. Almost nothing is known about less developed and emerging countries – with the exception of China (e.g. Lu et al. 2019). Our research contributes to this body of knowledge by examining Special Economic Zones in India and linking place-based policies to structural change and gendered employment effects – thus breaking new research ground (Gallé et al. 2024).
Our research provides evidence which suggests that place-based policies can contribute to structural change by shifting employment from agriculture to manufacturing and services and providing better employment opportunities, particularly for women.
India’s Special Economic Zones Act in 2005
Special Economic Zones (SEZs) became more widespread in India with the SEZ Act in 2005 and are located outside the domestic customs area to promote economic growth through exports. Unlike earlier zones, which were publicly managed, the policy allowed for privately owned zones and offered various benefits such as single window clearance for government approvals and generous tax exemptions of up to 100% for the first 10-15 years. SEZs were also exempt from sales and service tax, and the Minimum Alternate Tax until 2012, and duty-free on imports. This package of measures has led to a significant increase in the number of operational SEZs to 280 by 2024. SEZs are classified by industry. Among the most common, IT-zones now account for 60% of all operational zones today, followed by manufacturing (multi-product) zones (10%), and pharmaceuticals and engineering (around 5% each).
Did the Special Economic Zones Act in India boost employment?
To identify the effects of this policy, we compare employment changes between Indian municipalities hosting an SEZ and municipalities in the same region without an SEZ, before and after the implementation of the SEZ Act in 2005.
By further grouping municipalities into 5km rings around the zones, we can explore potential spillovers. Lower employment in locations adjacent to SEZs would indicate job displacement rather than new economic activity. Alternatively, new economic activity within SEZs could lead to new jobs in the wider area due to increased demand for goods or services such as restaurants.
In our baseline specification, shown in Figure 1a, we find that treated municipalities (those that received an SEZ) were characterised by 52 percentage points higher employment growth in manufacturing and services than the control group (municipalities without a SEZ). We also find positive employment spillovers. For example, employment growth in municipalities in the <5km and the 5-10km distance bins increased by 22 percentage points and 16 percentage points, respectively. A substantial share of these employment spillovers occurs in small and likely informal firms. While these figures are high, it should be noted that the average SEZ hosting municipality has only around 3,000 non-agricultural employees.
FIGURE 1: Employment effects of SEZ policy
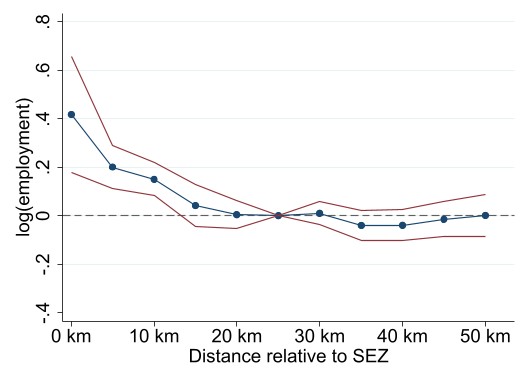
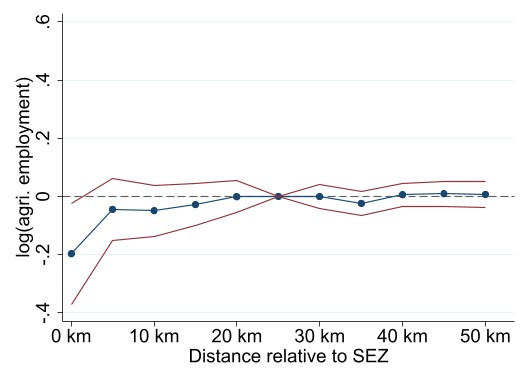
Notes: This figure shows the estimated employment changes (in logs) for manufacturing and services (left panel) and agriculture (right panel) for a municipality that received a new SEZ compared to control municipalities in a distance of 20-25km. Red lines indicate 95% confidence intervals. As the effects are measured in logs, the point estimate for SEZ municipalities in the left panel translates to (e0.418 -1)×100=52pp.
The impact of Special Economic Zones on agricultural and women’s employment
Second, we apply the same empirical strategy to examine changes in agricultural employment that were not directly promoted through the SEZ policy. Panel (b) of Figure 1 shows a negative effect in the agricultural sector within SEZ municipalities of –17 percentage points. The estimates are close to zero and statistically insignificant for neighbouring locations. Overall, this pattern suggests a reallocation of employment from agriculture to manufacturing and services, often referred to as structural change. This transition is widely seen as one of India’s main development challenges (Sud 2014), given the low productivity of the agricultural sector; the 50-60% of Indian workers employed in agriculture contribute only 18% to GDP (World Bank 2023a ,2023b). Furthermore, we find that the decline in employment is mainly driven by marginally employed workers, which is consistent with previous research highlighting structural change as a key driver of economic development (Eichengreen and Gupta 2011, Gollin et al. 2014). A back-of-the-envelope calculation suggests that the decline in agricultural employment is about one-third of the increase in non-agricultural employment.
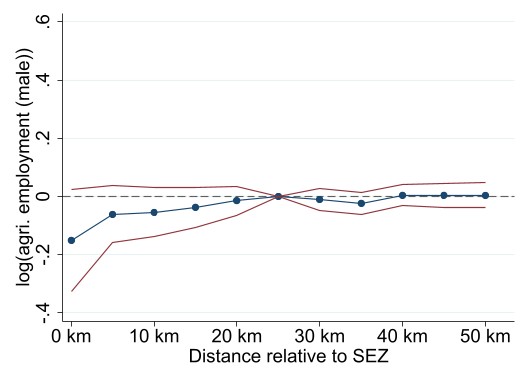
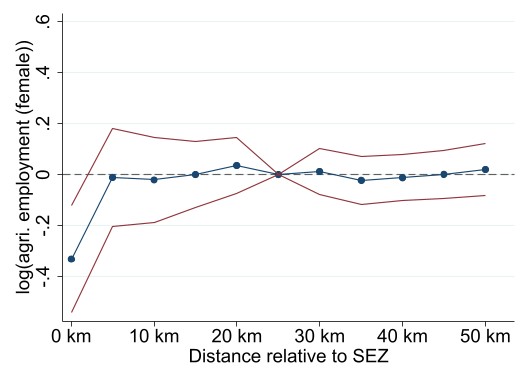
Third, we differentiate the employment effects by gender and by sector. Figure 2 shows that the decline in agricultural employment is more pronounced for women. One possible explanation for this finding is that men own most of the agricultural land in India (Agarwal et al. 2021), which may limit their responsiveness to alternative employment opportunities. Male employment increased in both manufacturing and services, while female employment increased particularly strongly in manufacturing (+55 percentage points). The SEZ policy has thus contributed to improved employment opportunities for women in the secondary sector. This is particularly important as women in India, as in other less developed countries, are a vulnerable group in the labour market. Gender discrimination is a widespread and long-standing phenomenon, and unemployment rates for women are significantly higher than for men (Klasen and Pieters 2015).
FIGURE 2: Employment effects by gender and industry
a) Agricultural: Male b) Agricultural: Female
c) Manufacturing: Male d) Manufacturing: Female
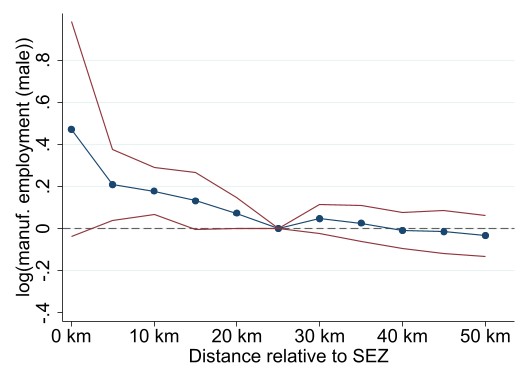
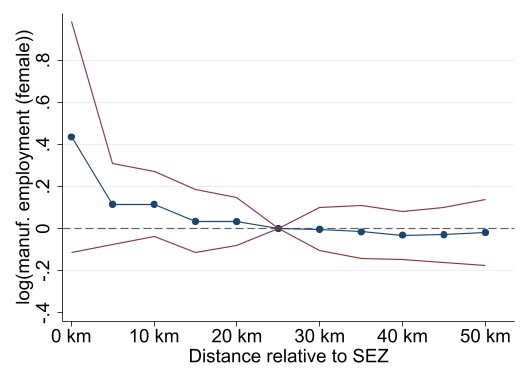
e) Services: Male f) Services: Female
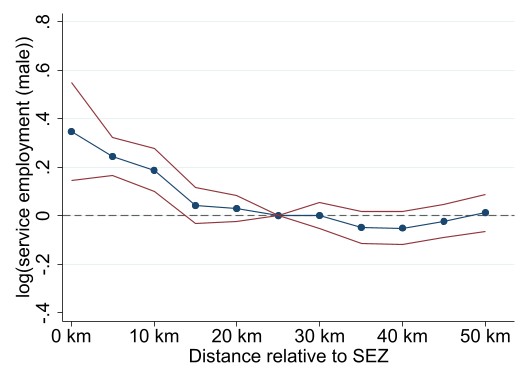
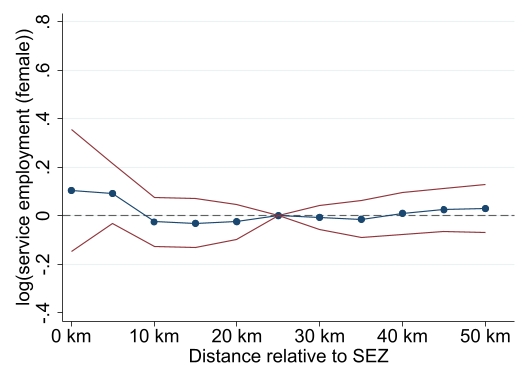
Notes: This figure shows the estimated employment changes (in logs) by industry and gender for a municipality that received a new SEZ compared to control municipalities in a distance of 20-25km. Red lines indicate 95% confidence intervals.
Special Economic Zones can play a key role in the structural transformation of developing countries
Special Economic Zones Act in India led to higher employment in the targeted manufacturing and service sectors, accompanied by a local decline in agricultural employment. This pattern indicates that the policy has facilitated a structural shift from an agriculture-based economy to one centered on manufacturing and services. Additionally, we show that the jobs of marginal agricultural workers, most likely women, are diminishing. This suggests that the SEZ Act has fostered better employment opportunities for women in particular. Overall, we conclude that the policy appears to have driven structural transformation in the Indian economy, provided better employment opportunities and promoted women's empowerment.
References
Agarwal, B, P Anthwal, and M Malvika (2021), “How many and which women own land in India? Inter-gender and intra-gender gaps,” The Journal of Development Studies, 57(11): 1807–1829.
Austin, B, E Glaeser, and L Summers (2018), “Jobs for the heartland: Place-based policies in 21st-century America,” Brookings Papers on Economic Activity, (Spring 2018): 578–590.
Eichengreen, B, and P Gupta (2011), “The service sector as India’s road to economic growth,” NBER Working Paper No. 16757.
Fajgelbaum, P, and C Gaubert (2020), “Optimal place-based policies,” The Quarterly Journal of Economics, 135(2): 959–1036.
Gallé, J, D Overbeck, N Riedel, and T Seidel (2024), “Place-based policies, structural change and female labor: Evidence from India’s Special Economic Zones,” Journal of Public Economics, 240 (December): 105259.
Gollin, D, D Lagakos, and M Waugh (2014), “The agricultural productivity gap,” The Quarterly Journal of Economics, 129(2): 939–993.
Neumark, D, and H Simpson (2015), “Place-based policies,” Handbook of Regional and Urban Economics, 5: 1197–1287.
Klasen, S, and J Pieters (2015), “What explains the stagnation of female labor force participation in urban India?” The World Bank Economic Review, 29(3): 449–478.
Lu, Y, J Wang, and L Zhu (2019), “Place-based policies, creation, and agglomeration economies: Evidence from China’s economic zone program,” American Economic Journal: Economic Policy, 11(3): 325–360.
Sud, N (2014), “Governing India’s land,” World Development, 60: 43–56.
World Bank (2023a, 20 February 2023), “Agriculture, forestry, and fishing, value added (% of GDP) - India,” Available at: https://data.worldbank.org/indicator/NV.AGR.TOTL.ZS?locations=IN.
World Bank (2023b, 20 February 2023), “Employment in agriculture (% of total employment) (modeled ILO estimate) - India,” Available at: https://data.worldbank.org/indicator/SL.AGR.EMPL.ZS?locations=IN.