The apparent paradox of high suicide rates in certain countries and regions with high happiness scores is confirmed, but inconsistent patterns emerge
Suicide is the ultimate act of desperate unhappiness, marking the point when life is going so badly, that no life at all is better than going on living. High suicide rates are often cited as evidence of social failure, as in Eastern Europe and the Soviet Union under communism. So it comes as a surprise that countries that do very well in life satisfaction, such as Finland, have among the highest suicide rates in Western Europe, or that the states in the ‘suicide belt’ in the United States, which stretches up the Rocky Mountains from Arizona to Montana, and on to Alaska, should be among those with the highest life evaluation.
Suicide has always posed a challenge to those who try to understand it – Durkheim’s famous book of 1897, Suicide, one of the foundations of empirical sociology, found many regularities, some of which still hold true today. Some economists, such as Layard (2005), or Helliwell (2007), who believe that self-reported life satisfaction (often referred to as 'happiness') summarises the success of a society, have argued that, in spite of the disturbing correlations, there is no real paradox, and that the same factors that promote happiness – high income, marriage, good health – also inhibit suicide.
In a recent study, we again confirm the paradox of high suicide rates and high life evaluation – we find that some of the factors that correlate with happiness also correlate with low suicide rates, but that just as many do not (Case and Deaton 2015). We further try to understand why suicide rates have recently increased among middle-aged Americans.
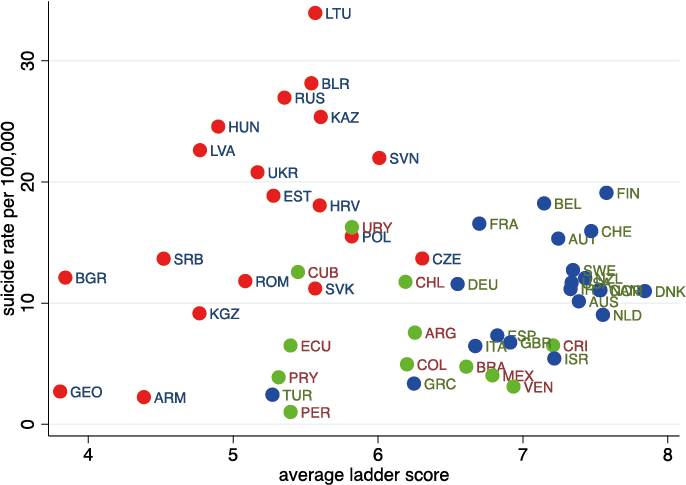
Figure 1. Suicide and life evaluation across countries

Figure 1 illustrates a typically ambiguous picture. It plots national suicide rates for 2006–2010 (deaths per 100,000 per year, age-adjusted, from the WHO’s mortality database) against mean life evaluation scores. The latter are taken from the Gallup World Poll, which asks people to place themselves on a ‘ladder’ from 0 to 10, where 0 is ‘the worst possible life,’ and 10 is ‘the best possible life.’ Although the overall correlation is negative – the non-paradoxical result that we might expect – the result is entirely driven by the comparison of Eastern European countries with wealthy countries1 and Latin America.2 The paradox arises within the wealthy countries and within Eastern Europe, where the correlations are positive. In particular, the highest income countries have high life evaluation and high suicide rates, while the opposite is true in the lower income rich countries. Within eastern Europe, the extraordinarily high suicide rates are again positively correlated with life evaluation. Much the same is true across the states of the US, with life evaluation and suicide rates highest in the West, and lowest in the East.
What about patterns over the life cycle? In the US today, as in other rich, English-speaking countries, life evaluation dips in midlife, and then rises with age among the elderly. In a partial match, suicide rates peak in midlife, but only for women. For men, suicide rates are approximately constant from ages 20 through 60, and then rise rapidly with age, which is nothing like the age pattern of life evaluation. Life cycle models can be constructed that predict suicide rates should rise with age (see Hamermesh and Soss1974), and the finding and claim for generality goes back to Durkheim. Indeed, suicide rates rise with age among the elderly, but this is true only for men, and even then, suicide rates rise alongside increases in life satisfaction.
What about the other factors that affect suicide and life satisfaction? Some match up, but more do not. Women have slightly higher life satisfaction than men, but much lower suicide rates. Blacks have slightly lower life evaluation than whites, but much lower suicide rates. Married people are more satisfied and are less likely to kill themselves, but while divorce strongly predicts suicide, it has a relatively modest effect on life satisfaction. Widowhood raises suicide among men but reduces it among women. Taking these and other factors (such as education) together, there are indeed matches but also many contradictions. The effects of personal circumstance on life satisfaction do not predict the effects of the same circumstances on suicide rates any better than spatial patterns of life satisfaction predict spatial patterns of suicide.
Unhappy Mondays
Americans kill themselves most often on Mondays, and the suicide rate declines through the week to Saturday, with Sundays a little higher, but still much less than Mondays. Most people would guess that something like this is true; Mondays can be bleak, but life looks better as the weekend approaches, though Sunday is a little overshadowed by the prospect of Monday. Yet this is not the pattern of life evaluation, which is much the same on all days of the week.
One objection to all this is that it is not mean life evaluation that matters, but the fraction of people whose life evaluation is at rock bottom; those who report zero, one, or two on the ladder. But it turns out that these measure are no more predictive of suicide rates than the mean.
Long-term patterns
Long-term patterns of suicide make rather more sense. Cutler et al. (2001) have shown that from the 1930s to the 1990s, suicide rates fell among the elderly. In the US, this pattern matches the long-term improvement in the relative economic status and health provision that were brought to the older population by Social Security and Medicare. Of course, we do not have the long-term data on life satisfaction that could clinch the argument.
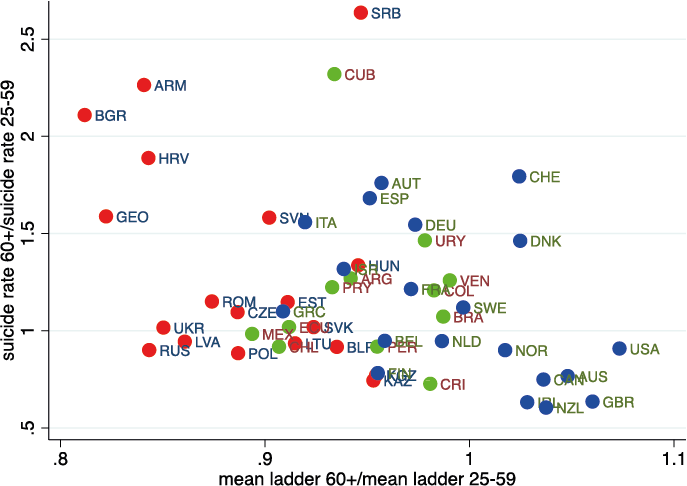
In our work, we find that, across the countries in Figure 1, countries where the elderly do relatively well in ladder scores are also the countries where the elderly do relatively well in suicide rates (see Figure 2). For example, in Britain, the mean ladder score of those aged 60 and over is 5% higher than the mean ladder score for those aged 25–59, and the suicide rates of the elderly are only about half of the rates for younger adults. At the other end of the scale, in Armenia and Bulgaria, ladder scores for the elderly are 15% lower than those for adults and suicide rates are more than twice as high. In many of the countries of Eastern Europe and the former Soviet Union, the transition was a disaster for the elderly. They lost a system that many believed in and, in many cases, lost their pensions too. At the same time, the world of opportunities opened up for young people like never before.
Figure 2. Old versus young, suicide and life evaluation

Except for these long-term trends, we suspect that life satisfaction and suicide do not, in reality, have much to do with one another. Life evaluation may refer to the long-term outlook, or to achievement as conventionally measured – education, income, marriage, and good health – while suicide may be an impulsive response to short-term factors. The impulse theory tends to implicate gun ownership, at least for men, for whom guns are the most common method of suicide; if the means of a quick and reliable exit is immediately at hand, suicide is more likely in response to short-term unhappiness. Somewhat surprisingly though, we replicate a finding of Cutler et al. (2001) that gun ownership is not related to suicide rates across counties within broad geographical areas, even though there is a great deal of variation of ownership across counties within those areas.
We do, however, find that suicide is strongly related to self-reported pain, across the states and (more strongly) across counties in the US. The prevalence of self-reported pain has been rising in midlife over the last 15 years, during which there has also been a rapid increase in midlife suicide. A large majority of suicides are associated with alcohol and drug abuse, which are also implicated in a spate of other deaths, from alcohol-related liver disease, and from accidental poisonings from alcohol and from illegal and prescription drugs. The puzzle is then not so much why an increase in these factors should increase suicide rates, but why this increasing distress does not show up in life evaluation. Perhaps this rising tide of mortality and morbidity in midlife explains the midlife dip in happiness, but this story runs up against the fact that the U-shape of happiness is apparent in other countries, none of whom are experiencing a similar epidemic.
Concluding remarks
The lack of any clear relation between suicide and happiness remains a disturbing and unresolved puzzle. Perhaps it is simply that suicide is hard to explain. But perhaps we should also be cautious giving too much weight to self-reports of life satisfaction.
References
Case, A and A Deaton (2015) “Suicide, age, and wellbeing: an empirical investigation”, NBER Working Paper, No. 21279.
Cutler, D M , E L Glaeser and K E Norberg (2001) “Explaining the rise in youth suicide”, in Jonathan Gruber, (ed.), Risky behavior among youths: an economic analysis, Chicago. UC Press for NBER.
Durkheim, E (1951) (1897), Suicide: a study in sociology, translated by John A. Spaulding and George Simpson, New York. The Free Press.
Hamermesh, D S and N M Soss (1974), “An economic theory of suicide”, Journal of Political Economy, 82(1): 83–98.
Helliwell, J F (2007), “Well-being and social capital: does suicide pose a puzzle?”, Social Indicators Research, 81(3): 455–96.
Layard, R (2005), Happiness: lessons from a new science, London. Allen Lane.
Footnotes
1 Western Europe, plus Australia, Canada Japan, New Zealand, and USA.
2 There are no reliable data on suicide for other regions of the world.
Photo credit: Annie Mole.


