New experimental methods, tested in Indonesia, can more accurately measure tax evasion by firms, revealing both the scale of tax evasion and providing insights into the characteristics associated with higher levels of evasion.
Editor’s Note: Read more about taxation and development in our most recent VoxDevLit.
High levels of tax evasion are considered one of the main reasons low- and middle-income countries collect relatively little revenue as a share of GDP (Jensen, Brockmeyer and Gadenne 2024). However, to date, it has been challenging to estimate the share of formal firms that evade tax and the characteristics associated with higher evasion. Relying solely on tax administrative data can be fraught due to misreporting, and it is challenging to show this without third-party information (Pomeranz 2015, Carrillo et al. 2017). On the other hand, directly asking taxpayers if they evade taxes does not result in honest answers, which is why many surveys ask about tax morale (Luttmer and Singhal 2014, Hoy 2022).
In new research (Hoy, Jolevski, and Obeyesekere 2024), we aim to overcome these challenges by implementing a ‘double-list experiment’ on a nationally representative sample of 2,955 formal firms in Indonesia as part of one of the largest World Bank Enterprise Surveys. The results suggest that around 25% of formal firms evade taxes, and evasion is particularly high among firms that don’t export, find tax administration to be a burden, and compete with the informal sector. We produce a back-of-the-envelope estimate that this rate of tax evasion translates into a revenue loss in the order of 2% of GDP. This is a substantial amount, given that the tax-to-GDP ratio is only around 10% in Indonesia.
Measuring tax evasion in Indonesia
To estimate the share of firms that evade taxes, we use a list experiment approach (also known as the “item count technique”), which is widely used to measure sensitive topics such as drug use and risky sexual behavior (Ahlquist 2018, Blair and Imai 2012, Imai 2011, Rosenfeld et al. 2016). This involves asking survey respondents to report only the number of statements on a list that apply to them, but not to reveal which statements are true. Respondents are randomly allocated into two groups, and the “treatment” group has an extra statement on the list about the sensitive behavior (in this study evading taxes). The average difference in the number of statements reported as true between the treatment and control groups reveals the incidence of the sensitive behaviour (in this case the rate of tax evasion).
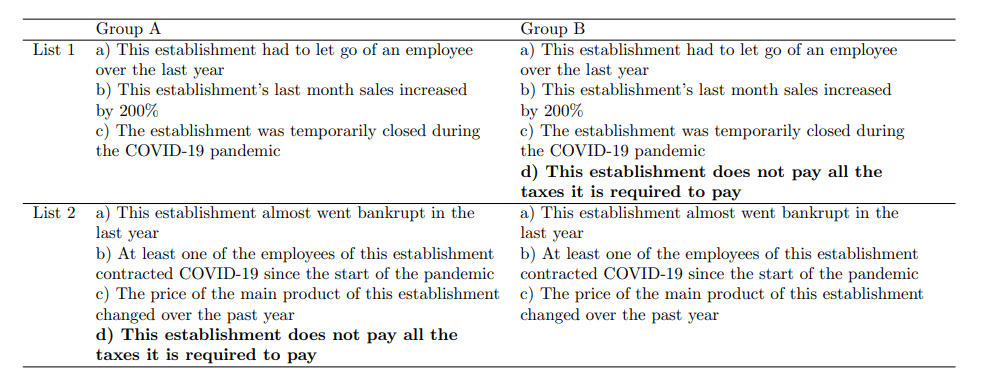
The design of our double-list experiment is shown in Table 1, where an extra statement about evading taxes is included in the list shown to respondents in the treatment group (i.e. Group B in List 1 and Group A in List 2). The extra statement about tax evasion (i.e. “This establishment does not pay all the taxes it is required to pay”) is identical to what has been trialed in single-list experiments in other countries (Dom et al. 2022). The non-sensitive statements in the double list experiment were carefully selected based on the Indonesian context at the time and fine-tuned through extensive piloting.
Table 1: Design of the double-list experiment (tax evasion statement is marked in bold)

Around a quarter of formal firms in Indonesia indirectly admit to evading tax
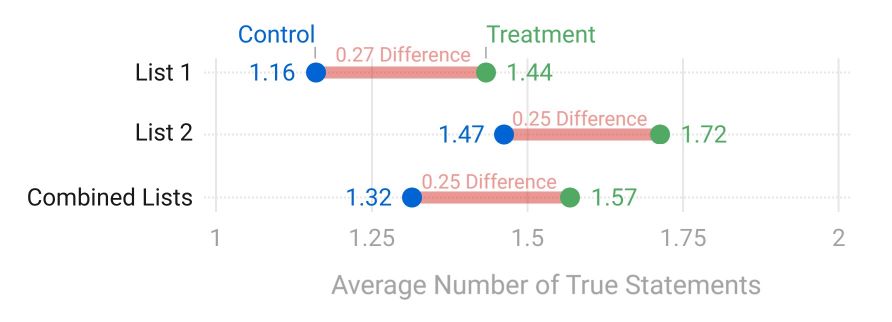
The results of the double list experiment suggest around one-quarter of formal firms indirectly report evading taxes. Figure 1 shows the average number of true statements reported in each list in the treatment and control groups, with the difference in average responses being the implied tax evasion rate. On average, in the first list, the control group reported 1.16 statements were true (compared to 1.44 in the treatment group), and in the second list, the control group reported 1.47 statements were true (compared to 1.72 in the treatment group). The difference was almost identical across both experiments (varying from 25 to 27%), which provides considerable reassurance of its accuracy.
Figure 1: The difference in the average number of true statements is the share of firms engaged in tax evasion

Firms that don’t export, compete with the informal sector, and that find tax administration to be a burden are the most likely to evade tax
The survey included extensive information about firm characteristics and the beliefs of top managers or owners, meaning there were many dimensions of heterogeneity of tax evasion that could be explored. We examined the dimensions associated with higher levels of tax evasion by using a machine learning algorithm that identified where substantial and consistent heterogeneity existed across both list experiments.
Figure 2 shows the three dimensions in which the highest rates of tax evasion were detected across both listing experiments. Firms that don’t export, compete with the informal sector, and find tax administration to be a burden are the most likely to evade tax. For example, the estimated rate of tax evasion using the combined lists for firms that find tax administration to be an obstacle is about 34% compared to 22% for firms that don’t. There was more limited variation based on other dimensions, which highlights just how widespread tax evasion is.
Figure 2: Domestically focused firms, those perceiving tax administration as an obstacle and those competing with the informal sector are more likely to evade taxes

These results suggest around 2% of GDP is lost from tax evasion by formal firms in Indonesia
For illustrative purposes, we produce a back-of-the-envelope estimate of the share of GDP lost in revenue due to formal firms evading taxes. We combine the double list experiment results (which suggests around 25% of formal firms evade tax) with the results of another survey question which shows that respondents estimate that non-compliant formal firms only pay around 23% of the taxes they owe. These figures are applied to the existing share of GDP collected by the Indonesian government from firms, which is around 8%. This analysis produces a back-of-the-envelope estimate of around 2% of GDP lost in revenue due to tax evasion by formal firms.
Policy implications: How to reduce tax evasion among formal firms
This study illustrates how common tax evasion is among formal firms in middle-income countries and the types of formal firms most likely to evade tax. The results show that substantially more revenue could be collected if governments could reduce tax evasion by formal firms. In addition, it helps guide revenue authorities as to the types of formal firms they should consider focusing their compliance efforts on (e.g. non-exporting firms and those that compete with the informal sector). Further, the higher rates of evasion by firms that see tax administration as a major obstacle provides evidence that efforts to simplify tax systems may lead to increases in compliance and, consequently, revenue.
Disclaimer: The findings, interpretations, and conclusions expressed in this blog are entirely those of the authors. They do not necessarily represent the views of the International Bank for Reconstruction and Development/World Bank and its affiliated organisations, or those of the Executive Directors of the World Bank or the governments they represent.
References
Ahlquist, J S (2018), “List experiment design, non-strategic respondent error, and item count technique estimators,” Political Analysis, 26(1): 34–53.
Blair, G, and K Imai (2012), “Statistical analysis of list experiments,” Political Analysis, 20(1): 47–77.
Carrillo, P, D Pomeranz, and M Singhal (2017), “Dodging the taxman: Firm misreporting and limits to tax enforcement,” American Economic Journal: Applied Economics, 9(2): 144–164.
Hoy, C (2022), “How does the progressivity of taxes and government transfers impact people’s willingness to pay tax? Experimental evidence across developing countries,” World Bank Policy Research Working Papers, 10167. Washington, DC: World Bank.
Hoy, C, F Jolevski, and A Obeyesekere (2024), “Revealing tax evasion: Experimental evidence from a representative survey of Indonesian firms,” Policy Research Working Paper, 10857. Washington, DC: World Bank.
Imai, K (2011), “Multivariate regression analysis for the item count technique,” Journal of the American Statistical Association, 106(494): 407–416.
Jensen, A, A Brockmeyer, and L Gadenne (2024), “Taxation and development,” VoxDevLit, 12(1).
Luttmer, E F P, and M Singhal (2014), “Tax morale,” Journal of Economic Perspectives, 28(4).
Pomeranz, D (2015), “No taxation without information: Deterrence and self-enforcement in the value added tax,” American Economic Review, 105(8): 2539–2569.
Rosenfeld, B, K Imai, and J N Shapiro (2016), “An empirical validation study of popular survey methodologies for sensitive questions,” American Journal of Political Science, 60(3): 783–802.


